
Get an overview with the Behavior Analytics dashboard
Use the Behavior Analytics dashboard to check your website's experience score, find the pages and segments with the most friction, and jump straight to their heatmaps and recordings.
The Wingify Guide can move a cursor on your screen inside the app and walk you through this, click by click (3 steps).
#When to use this
You don't have time to open every heatmap and recording, and you want to know where to look first. The Behavior Analytics dashboard gives your website an experience score out of 100, based on dead and rage clicks. It then ranks the pages and visitor segments that struggle most, with links to their heatmaps and recordings. It also summarizes your latest form and survey campaigns. Use it as a weekly health check and a starting point for new test ideas.
#Before you start
- Your website is connected and the SmartCode is installed. Otherwise the dashboard shows No website connected with a Connect Now button.
- Session Recordings and Heatmaps are enabled, so there's session data to score. Until enough data exists, sections show "Insufficient data".
- The dashboard only covers sampled visitors. See How Sampling Works.
#Steps
#1. Open the dashboard
Go to Behavior Analytics > Dashboard. The first time, an Introducing Behavior Analytics panel appears. Click Next to browse it, Explore Now to close it, or Read more to open the documentation.
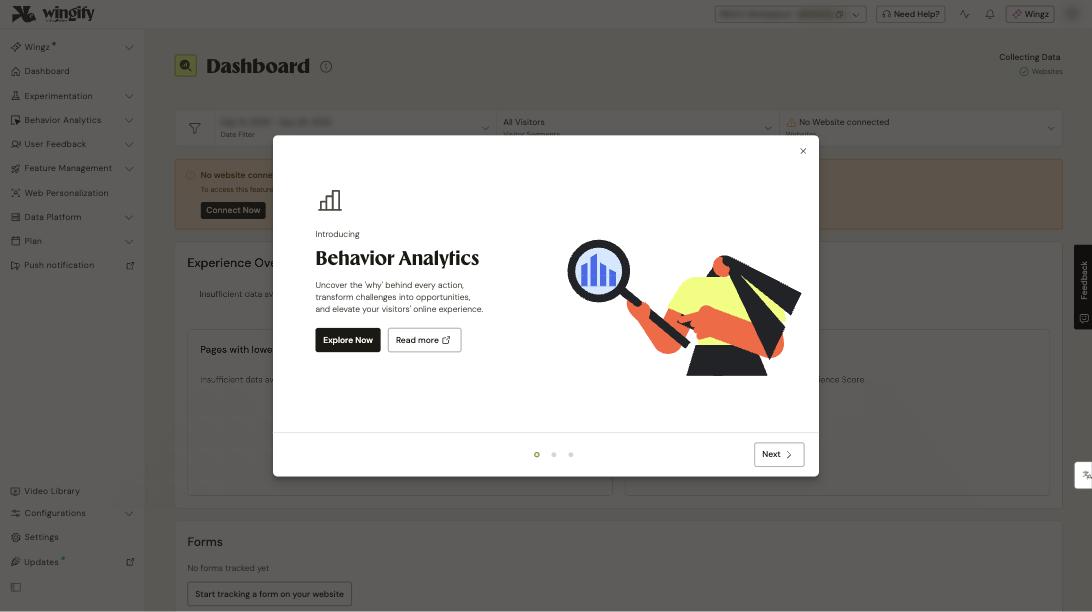
The top-right corner shows the data collection status. Click View details to see sampled visitors, data retention and whether Heatmaps and Session Recordings are active.
#2. Set the filters
Use the filter bar at the top:
- Date Filter – the last 15 days by default. You can also choose the last 30 or 7 days, yesterday or today.
- Visitor Segments (shows All Visitors) – besides custom attributes, you can filter by Traffic Source, Operating System, Device Type and Visitor Type.
- Websites – pick one or more of the domains registered in Websites and Apps. All domains are selected by default.
Click Filter to apply.
#3. Read the experience score
The Experience Overview section shows your overall experience score out of 100 and a trend graph over the selected dates. Each session gets a score based on its share of dead and rage clicks:
Session score = {1 − 0.5 [D / (D + C) + R / (R + C)]} × 100%
where D is dead clicks, R is rage clicks and C is non-struggle clicks. The overall score is the average of all session scores. A falling line after a release is a strong signal to investigate.
#4. Drill into the pages with the lowest scores
Under Pages with the lowest experience scores, each URL has View Heatmap and View Recording icons. Click a URL to open its page overview, which shows:
- The page's experience score and the % of sessions with dead and rage clicks.
- A friction trend over the period.
- The segments and sessions with the lowest scores.
- The elements that received the most dead and rage clicks.
- An Error Logger listing uncaught, console and network errors, with the % of sessions affected.
Every item links to the matching session recordings.
Tip: To check a page that isn't in the list, click Get behavior analytics for a particular page and enter its URL.
#5. Check the segments with the lowest scores
Segments with the lowest experience scores lists visitor groups that struggle, for example visitors on a specific browser. Click View Recording to watch their sessions and confirm whether it's a UI glitch or a content problem.
Note: Page and segment insights are generated once a day, so they don't reflect live status.
#6. Review forms and surveys at a glance
Scroll down to:
- Forms – your two most recent form campaigns, with the number of fields and how many visitors landed, interacted and submitted. Click → to open one, View all to see all of them, or Create Form Analytics Campaign (or Start tracking a form on your website if you have none).
- Surveys – your two most recent surveys, with the number of questions and how many visitors viewed, answered and submitted. Use →, View all or Create Survey.
#Check that it worked
Once data is flowing, the status at the top right reads Collecting Data. The Experience Overview then shows a score and graph instead of "Insufficient data". Clicking a page URL opens its overview with links to recordings.
#Common questions
What lowers my experience score? Dead clicks (clicks on elements that look interactive but aren't) and rage clicks (rapid repeated clicks on the same area). Both are counted relative to normal clicks in each session.
Why doesn't my newest page appear in the list? Page insights are refreshed once a day, and Wingify groups data by canonical URL. Use Get behavior analytics for a particular page to look it up directly.
Which errors does the Error Logger show? Uncaught errors, console errors and network errors that occurred on the page. Each one shows the average experience score of the sessions it affected.
Can I filter the dashboard by any segment? You can use custom segments plus four standard attributes: Traffic Source, Operating System, Device Type and Visitor Type.