
See where visitors click with heatmaps
Generate click, scroll and friction heatmaps for any page, save a view for a visitor segment, and open heatmaps for each variation of a test.
The Wingify Guide can move a cursor on your screen inside the app and walk you through this, click by click (4 steps).
#When to use this
You want to know whether visitors actually notice your main call to action, how far they scroll before leaving, or where they click on things that aren't clickable. A heatmap plots every sampled visitor's clicks, scrolls and hovers on your live page, so you can spot ignored CTAs, frustrating elements and content placed too low. You can also open heatmaps per variation of a running test to see why one version wins.
#Before you start
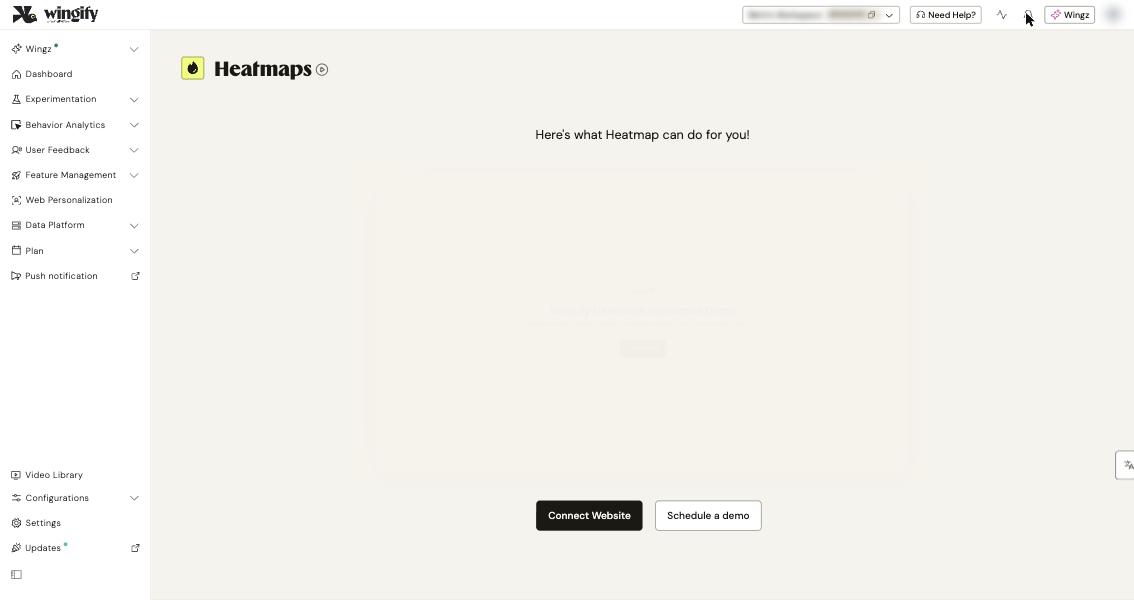
- The Wingify SmartCode is installed on every page you want to analyze. If your website isn't connected yet, the Heatmaps page shows a Connect Website button.
- You have a Behavior Analytics plan that includes Heatmaps. Compare Heatmaps requires Behavior Analytics Pro or Enterprise.
- Heatmaps only collect data from sampled visitors. See How Sampling Works.
- On Safari, disable Prevent cross-site tracking (Safari > Settings > Privacy), or heatmap data may not load.
#Steps
#1. Open Heatmaps and enable data collection
Go to Behavior Analytics > Heatmaps. If this is your first time, click Enable Now. Wingify then starts collecting data on all pages that have the SmartCode; there's nothing to set up per page. Data appears only from this point on.
Tip: To stop collecting data on pages that don't matter (for example, a Contact Us page), click the Settings gear icon and add them to Exclude URLs. Excluded pages still consume sampling quota.
#2. Enter the page URL and choose a visualization
In Enter the URL for which you want to see the heatmap, type the page URL. To combine several pages that share a template (such as all product pages), open Advanced and use a pattern with the * wildcard. Then pick a visualization:
- Heatmap – color-coded click density, from blue (low) to red (high).
- Clickmap – exact number and percentage of clicks per element on hover.
- Scrollmap – percentage of visitors who reach each depth of the page.
- Click area – draw zones to compare clicks between sections.
- Hovermap – where the cursor pauses (desktop only).
- Element list – clicks per element in a table.
- Frictionmap – dead clicks, rage clicks and error clicks.
- Zonalmap – aggregated clicks and metric conversions per zone (early access).
#3. Filter by date, segment, device or campaign
Narrow the data before you generate the map:
- Date Filter – defaults to the last 30 days.
- Visitor Segments – pick a default or saved segment, or build a custom one (traffic source, location, device and more).
- Campaign Filter – choose a test campaign and a Variation to see only visitors who saw that version. You can add up to 3 campaigns.
Click View Heatmap.
#4. Read the report and look for friction
The heatmap opens on your live page with a control panel at the bottom. Use it to switch visualization, change Device Type, adjust Intensity, click Navigate to browse to pages behind a login, or Add Observation on a specific area.
To find frustration, select Frictionmap and use the Friction Type dropdown to switch between Dead clicks, Rage clicks and Error clicks. Drag over a hot area to open the 5 most recent Session Recordings of visitors who clicked there, or click Summarize for an AI summary of those sessions (requires Data Platform).
Note: By default the map loads only the latest 5,000 clicks for speed. Use the click type dropdown to switch to All clicks or First
#5. Save a view for a recurring analysis
To track the same page and segment over time, click Create View in the right panel. Name the view with the pencil icon, enter the URL, optionally enable Enable tracking heatmap data for a specific visitor group, set a schedule under Advanced Options, and click Create. A view collects data only from the date it is created.
#6. Compare heatmaps or open them from a test
- Click Compare to show two heatmaps side by side (for example, mobile vs. desktop, or new vs. returning visitors). Synchronous Scrolling keeps both in step.
- For a test, open the campaign from Experimentation > Web Experimentation and go to Reports > Behavioral Analysis > Heatmaps. Each variation has a card with View Heatmap and a Compare dropdown with Add to Compare and Compare Conversion vs Non-Conversion.
#Check that it worked
Your saved view appears in the Views panel on the Heatmaps page, and its Timeline tab shows when data collection started. After visitors land on the page, generating the heatmap shows plotted clicks. For campaign heatmaps, data usually appears within a few minutes to an hour.
#Common questions
Why does my heatmap show fewer clicks than page visits? Wingify records only the first 10 clicks per visitor per page, and only sampled visitors are tracked. Clicks on elements that were removed, redirected, or that have dynamic IDs can't be plotted either.
How do I see clicks inside a dropdown menu? Hold Control while hovering over the menu, then press Shift once the sub-menu opens. The heatmap refreshes and shows clicks on the sub-menu items.
My page has a unique ID in the URL. How do I get one heatmap for all users? Use a URL pattern with * in place of the variable part (for example, www.example.org/user/*). The same trick consolidates HTTP and HTTPS versions.
Is there a click limit? Heatmaps created as part of a test plot up to 100k clicks. Standalone heatmaps have no plotting limit.
What's the difference between All Clicks and Latest Clicks? Latest clicks shows the most recent clicks for faster loading; All clicks shows every click over time. The All clicks option appears only after the page exceeds 5,000 clicks.
#Learn more
- Introduction to Heatmaps
- Interpreting Heatmap Reports in Wingify
- Compare Heatmaps in Wingify
- Understand Campaign Performance Through Integrated Heatmaps
- Troubleshooting: Heatmap Not Showing Clicks
Help-center sources (8)
- Introduction to Heatmaps
- Using Heatmaps Dashboard in Wingify
- Interpreting Heatmap Reports in Wingify
- How to View Heatmaps for a URL in Wingify
- Creating a Heatmap View in Wingify
- Compare Heatmaps in Wingify
- Understand Campaign Performance Through Integrated Heatmaps
- Troubleshooting Heatmap Not Showing Clicks in Wingify