
Monitor KPIs with Metric Reports
Turn any Data Platform metric (clicks, page visits, form submissions, revenue) into a report that tracks its trend over time, by segment.
The Wingify Guide can move a cursor on your screen inside the app and walk you through this, click by click (4 steps).
#When to use this
You want a running view of the numbers that matter to your business, not only while a test is live. For example, you want daily signup-button clicks, add-to-cart events, or revenue, and you want to split them by device or traffic source. A Metric Report tracks one Data Platform metric over time, and links to heatmaps, session recordings and funnels so you can find out why a number moves.
#Before you start
- The Wingify SmartCode is installed on the pages where the metric happens.
- Your account uses Data Platform metrics. If you still track Goals, migrate them first (see Common questions).
- Metric Report data comes from sampled visitors. You can adjust the sampling rate with Flexible Sampling.
Note: Starting September 9, 2026, new accounts find Metric Reports in Journey Analytics. Existing accounts keep Behavior Analytics > Metric Reports. See Use Metric Reports in Journey Analytics.
#Steps
#1. Open Metric Reports
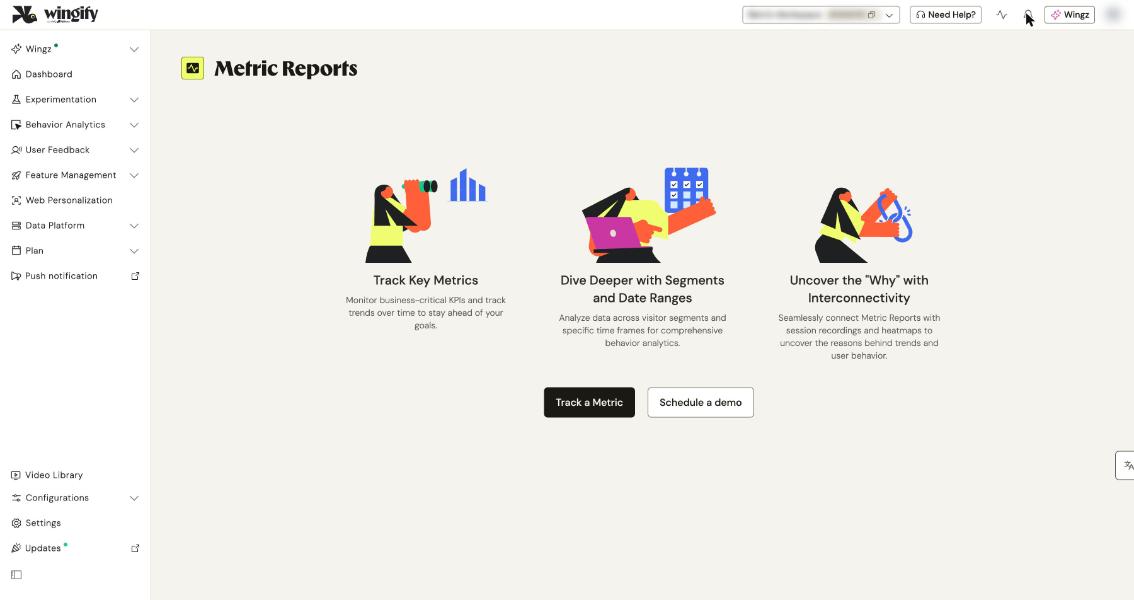
Go to Behavior Analytics > Metric Reports. If you don't have any reports yet, click Track a Metric. Otherwise, click Create. To see what a finished report looks like first, click View Sample Report.
#2. Pick an existing metric, or create one
On the New Metric Report page, select a metric from the list and click Start Tracking. A metric that's already used in another report can't be selected again.
To track something new, click Create new metric and fill in:
- Metric Name, for example Signup button clicks.
- Event you want to track for this metric – a standard event such as Page visit, Click, Form submit, Engagement, Page unload or Bounce, or one of your custom events. Click + where to set the page URL, then + and where to identify the element (for example Selector Path, HTML Id or Text).
- Metric will calculate – Unique visitors (count each visitor once), Event totals (count every occurrence), or Value of an event property (for example, the sum of revenue).
Then click Start Tracking.
Tip: You can also start from Data Platform > Metrics. Select a metric and click Create Metric Report for a one-click setup, then View Report.
#3. Filter the report
Open the report from the Metric Reports list. Narrow the data with:
- Date Filter – last 30 days by default. You can also choose the last 15 or 7 days, yesterday or today.
- Visitor Segments – for example, paid vs. organic, or mobile vs. desktop.
- Report-specific filters – Metric URL to focus on specific pages, and Metric Property (for example, revenue value) when the metric tracks a property.
#4. Read the metric overview chart
The chart shows conversions (or a property such as Revenue) over the selected period. Each filter you apply updates it. Look for trends, sudden drops after a release, or segments that underperform.
#5. Investigate with heatmaps, recordings and funnels
From the report's integrations section, jump to:
- Heatmaps of pages related to the metric, to see where visitors hesitate.
- Session Recordings of visitors who did or didn't convert on the metric.
- Funnels that contain the metric, to see which step loses people.
You can also filter Session Recordings by Metric Report under Visitor Segments.
#Check that it worked
The new report appears on the Metric Reports dashboard. Trigger the event yourself (for example, click the button you're tracking) and refresh the report. Metric Report data updates in real time, but visits that aren't sampled won't appear.
#Common questions
How is this different from a goal? Goals only exist inside one campaign. A metric is defined once in Data Platform and can be reused in reports and tests. It can also count repeat conversions, such as the number of times a visitor pays. Goals in Behavior Analytics are being discontinued.
How do I migrate an existing goal? Go to Behavior Analytics > Goals, open the goal and click try migrating this Goal. Review the auto-filled Migrate Goal as Metric Report panel and click Create. The new report starts collecting data from scratch, and targeting isn't carried over. To keep audience settings, choose migrate it as a Funnel instead.
Why do my migrated numbers differ from the old goal? Metric Reports count differently. For example, a unique page-visit metric counts a visitor once for their whole lifetime, while goals could count once per session. For revenue, you pick either first values or the sum of all values.
How long can I track a trend? That depends on the data retention period of your Behavior Analytics plan. See the Data Retention Policy.