
Track time spent, scroll depth and clicks on specific text
Create Data Platform metrics that measure time on page, scroll depth and clicks on a given text, and use engagement events as triggers for your campaigns.
The Wingify Guide can move a cursor on your screen inside the app and walk you through this, click by click (7 steps).
#When to use this
Clicks and purchases don't tell the whole story. You may want to know whether a new product banner makes visitors leave within 10 seconds, whether visitors who read 75% of a page buy more, or how often a "Sign Up" button is clicked whether it's in the header or the footer. Wingify handles all three with standard events in Data Platform, turned into metrics you can add to campaigns. The same events also power triggers, which decide when a campaign is shown.
#Before you start
- Your workspace uses Data Platform (text-based click tracking is exclusive to Data Platform accounts).
- The Wingify SmartCode is installed on the pages you want to measure.
- No extra code is needed: Page Unload and Click are standard events.
#Steps
#1. Look at the standard events available
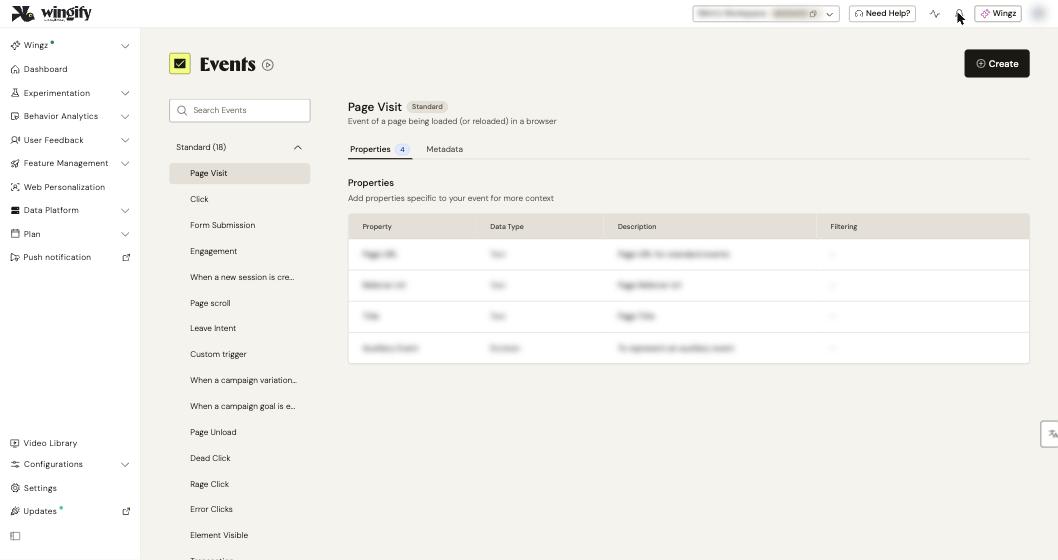
Go to Data Platform > Events. The Standard list includes Page Visit, Click, Form Submission, Engagement, Page scroll, Leave Intent, Page Unload and more. Click an event to see its Properties tab. Page Unload carries the time spent on the page (Duration) and the scroll depth when the visitor left.
#2. Create a time-spent metric
Go to Data Platform > Metrics and click Create.
- Enter a Metric Name, for example Left product page in under 10 s.
- Select the Page unload event.
- Click + where: Page URL is filled in by default. Set the URL match condition and URL.
- Click + and where, select Duration, pick a condition (for example less than) and enter a value in seconds. Skip this if you only want to measure time spent, not filter by it.
- Under Metric will calculate, choose Unique visitors, Event totals, or Value of an event property with First value, Last value, Sum, Average, Maximum value or Minimum value to measure the time itself.
- Optionally click Add description, then click Create.
#3. Create a scroll-depth metric
Create another metric with the Page unload event and the Page URL condition. Then click + and where and choose one of:
- Vertical scroll depth (Percentage) or (Pixels),
- Horizontal scroll depth (Percentage) or (Pixels).
Set the condition and value, for example vertical scroll depth greater than or equal to 75.
Tip: To ignore fast scrollers, add another + and where with Duration. Someone who reaches 80% in 5 seconds probably isn't reading.
Choose how to count under Metric will calculate (as in step 2) and click Create.
#4. Create a metric for clicks on a specific text
Use this when the same button appears in several places with different selector paths, or when a selector changes after a redesign.
- In Data Platform > Metrics, click Create and name the metric.
- Under Visitors event you want to track, select Click, then select Text as its property.
- Pick a comparison operator and enter the text, for example View Shirts or Sign Up.
- Choose how to count under Metric will calculate and save the metric.
Every element containing that text is tracked, wherever it sits on the page.
#5. Add the metrics to a campaign
Open your A/B, Split URL, Multivariate or Personalization campaign, go to the Metrics step, click Add and select your new metric. See Choose the metrics that decide your test. You can also report on a metric outside tests with Metric Reports.
#6. Use engagement as a trigger (optional)
Metrics measure engagement; triggers act on it. Go to Data Platform > Triggers. The Standard triggers include Page Viewed, Attempts to close page, Time spent on page > 10 seconds, Page scrolled > 50% and Session time > 60 seconds.
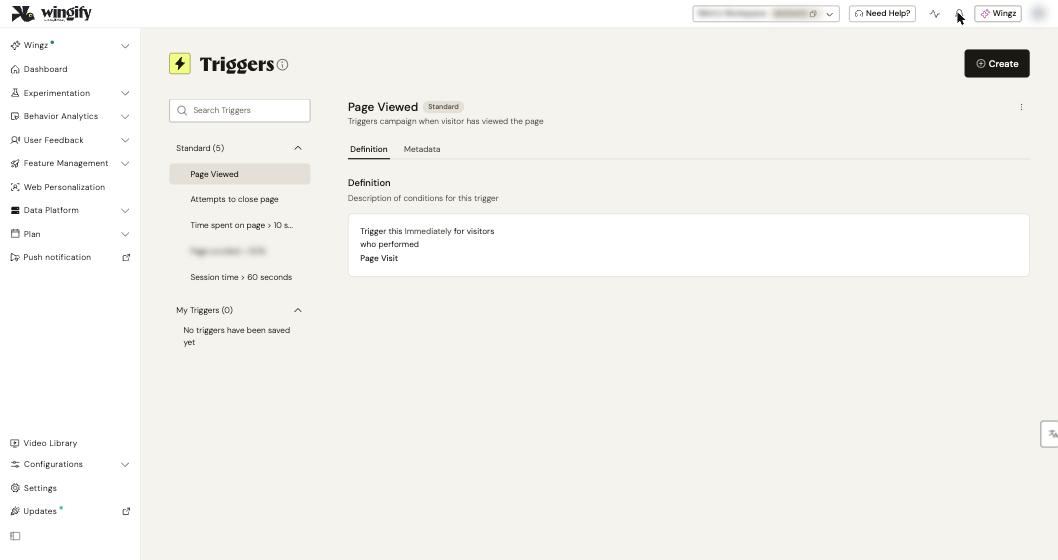
To build your own, click Create, pick an event, add property conditions with + and where, and combine events with And, Or or And then (after that or within a number of seconds). Save it: it appears under My Triggers. Apply triggers in a campaign under Targeting > Triggers, and set the Frequency (for example Once per session).
#Check that it worked
- Open Data Platform > Audit, browse your page, then leave it: a Page Unload event should appear with its duration and scroll values. See Check incoming events live with Audit.
- In your campaign, use REVIEW > Live Preview to confirm the metric fires.
- After launch, the metric appears in the campaign Reports.
#Common questions
Why is my time-spent or scroll metric based on Page Unload? The duration and scroll depth are known only when the visitor leaves the page, so these metrics count visitors who left the page after (or before) reaching your threshold.
Should I use Unique visitors or Event totals? Unique visitors counts each visitor once. Event totals counts every occurrence, for example each time a visitor meets the scroll condition. Use Value of an event property to report the time or scroll level itself.
The same text appears on buttons that do different things. Is that a problem? Yes: text-based tracking counts all elements containing the text. Combine it with a URL condition, or use a selector-based click metric for a single element.
Can a trigger affect conversion tracking? Yes. With Every time selected for trigger checks, visitors must also meet the trigger conditions on metric pages for conversions to be recorded.