
Look up a visitor's profile, events and recordings
Open a single visitor's profile in Data Platform to see their attributes, the events they triggered, their session recordings and their survey responses.
The Wingify Guide can move a cursor on your screen inside the app and walk you through this, click by click (5 steps).
#When to use this
A customer reports that the discount banner never appeared for them, or a teammate flags an odd conversion in a test report. Profiles gives you one visitor's full picture in one place: who they are (attributes), what they did (events), how they browsed (session recordings) and what they told you (survey responses). Profiles cover visitors who took part in your Web Experimentation, Behavior Analytics, Web Rollout or Web Personalization campaigns.
#Before you start
- Your account has access to Data Platform.
- The visitor must have been part of at least one active campaign; events are only shown for actions triggered during active campaigns.
- Recording tabs show data according to your plan (web or mobile recordings).
#Steps
#1. Open Profiles
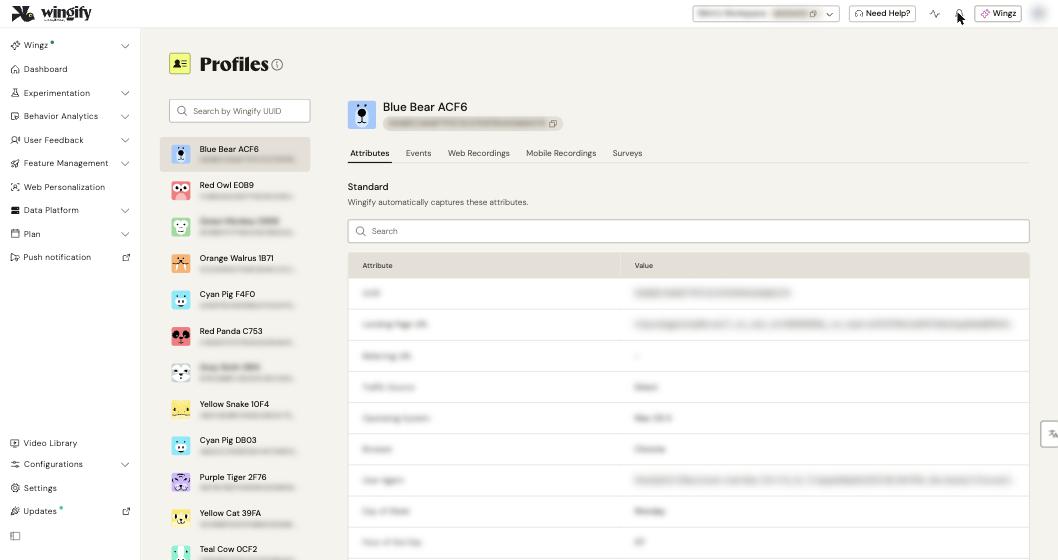
Go to Data Platform > Profiles. The list shows visitor UUIDs, most recent visitors first. Each visitor also gets a readable nickname (for example, "Blue Bear ACF6").
#2. Find the visitor
Click a visitor in the list, or paste a UUID into the Search UUID field (shown as "Search by Wingify UUID"). The visitor's profile opens on the right.
Tip: To share a profile with a teammate, click the Copy icon next to the UUID and send it. Anyone with access to Profiles can paste it into the search field.
#3. Review the visitor's attributes
The Attributes tab lists standard attributes that Wingify captures automatically (such as traffic source, operating system and browser) and your custom attributes, with their values. Use the search box to filter by attribute name or value.
Note: If collection of a standard attribute is blocked by browser or account settings, that field stays empty.
#4. Follow the events timeline
Open the Events tab to see a timeline of the actions the visitor triggered during active campaigns, grouped by date and timestamped. Click an event to see its name, description, API name, trigger time (HH:MM:SS) and its properties with values.
#5. Watch the visitor's recordings
Open Web Recordings (or Mobile Recordings, depending on your plan). Each row shows Location/Source, Pages (or Screens), Duration and Created On. Click the play button to watch a session, or use the ⋮ menu to share, save, download or delete it. On Web Recordings, click Saved Recordings to see only saved sessions. The 10 most recent recordings are shown by default.
#6. Check survey responses
Open Surveys to see every survey shown to the visitor, with Display Time and Completed Time. Click View Responses to open the Respondent View Survey Report with their answers. The option is disabled if the visitor didn't answer any question.
#Check that it worked
The visitor's nickname and UUID appear at the top of the right-hand panel, and each tab (Attributes, Events, Web Recordings, Mobile Recordings, Surveys) loads data for that visitor only. If a custom attribute or event you expect is missing, check that its tracking code is installed (see Track custom events and attributes).
#Common questions
Why don't I see Segments, Metrics or Funnels in a profile? These tabs are part of planned features and will be available in a future release.
Why is a recording tab empty? Recording data depends on your subscription: web recordings for web plans, mobile recordings for mobile plans. The visitor also needs to have been recorded during a session.
Which events appear in the timeline? Actions the visitor triggered on your website during active campaigns, including standard events (such as page visits and clicks) and your custom events.