
Turn research into a prioritized testing backlog
Record observations from your research, turn them into scored hypotheses, and track them from backlog to completed test in Plan.
The Wingify Guide can move a cursor on your screen inside the app and walk you through this, click by click (7 steps).
#When to use this
Your heatmaps show visitors ignoring the checkout button, session recordings show them stalling on shipping costs, and your funnel shows a drop-off at checkout. Instead of scattering these findings across documents, record each one as an observation, turn the promising ones into hypotheses ("I expect that... will address..."), score them, and work through them in order. Plan keeps the trail from insight to test result.
#Before you start
- Your account has access to Plan.
- Only administrators can customize the hypotheses workflow board.
- Optional: research data in Behavior Analytics (heatmaps, recordings, funnels, forms, surveys) to record observations from.
#Steps
#1. Record an observation
Go to Plan > Observations and click Create an Observation (or Create if you already have some). Fill in:
- Description: what you noticed (maximum 200 characters).
- Page URL: where you noticed it.
- Attachments: supporting files, if any.
- Labels: tags to filter observations later.
Click Create.
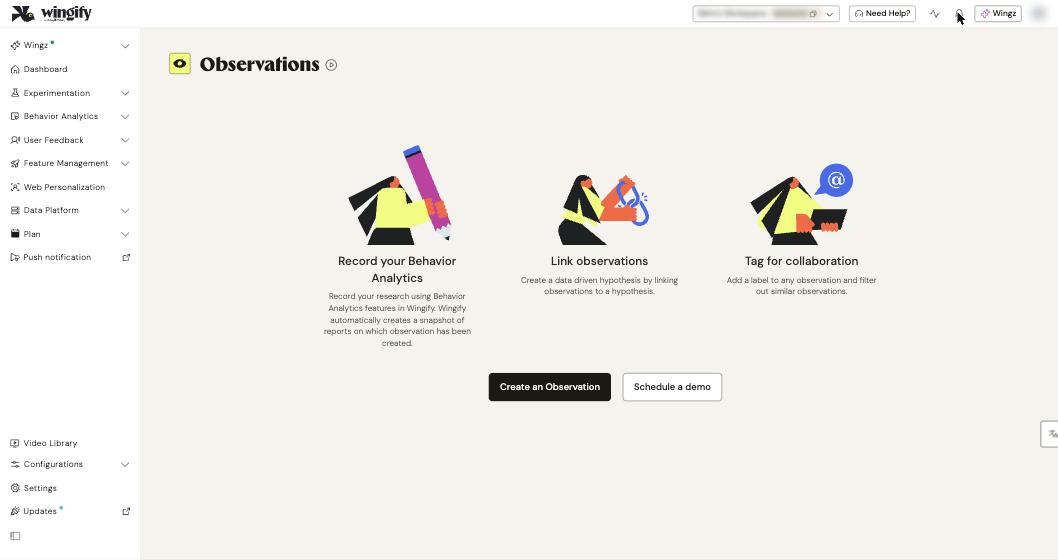
Tip: You can also create an observation directly from a Behavior Analytics report, for example from a funnel, heatmap or recording. Wingify adds context from the report, and the observation gets a View Snapshot link back to it.
#2. Turn observations into hypotheses
In Plan > Observations, select the checkbox next to an observation. Click New Hypothesis to create one from it, or Link to Existing Hypotheses to attach it to a hypothesis you already have.
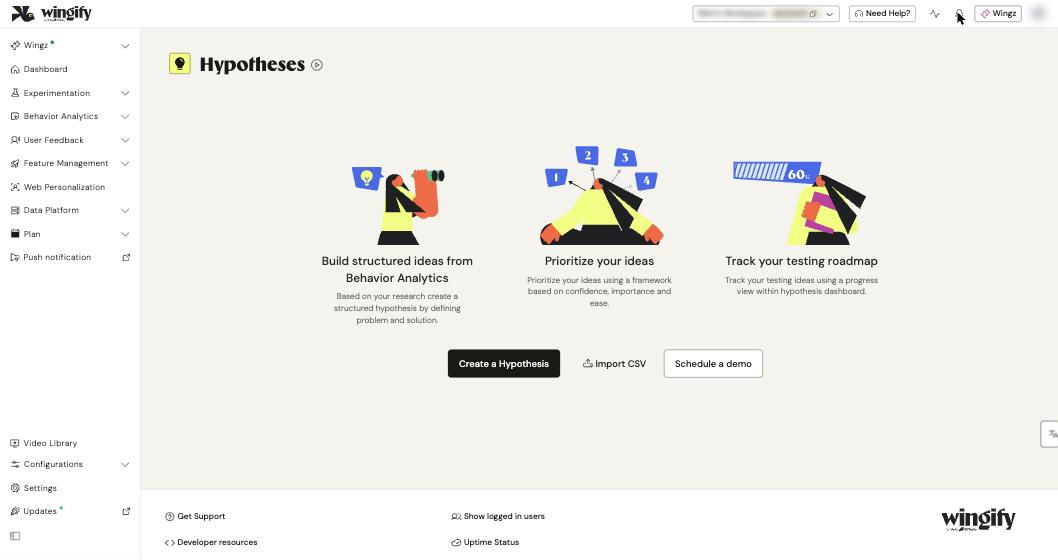
You can also go to Plan > Hypotheses and click Create a Hypothesis (or Create). In the New Hypothesis pop-up, fill in:
- Based on Observation: the problem or insight.
- I expect that: the change you'll make and its expected effect.
- Will address: the problem it solves.
- Source: the page URL (or backend service, for Feature Management).
- Attachments and Labels (optional).
#3. Score each hypothesis
In Prioritization Score, pick a framework from Prioritization Framework: CIE (Confidence, Importance, Ease; the default), PIE (Potential, Importance, Ease) or ICE (Impact, Confidence, Ease). Rate each parameter from 1 to 5. The score is the average; for example, ICE scores of 3, 4 and 5 give 4.0. Click Create. The hypothesis appears in the Backlog lane.
Tip: Have many ideas in a spreadsheet already? Click Import CSV on the Hypotheses page to bulk import them.
#4. Organize your pipeline
The Hypotheses page opens in Progress View, a board with lanes: Backlog, Selected For Testing, Completed and Archived. Drag cards between lanes as work progresses. Switch to Table View to sort by score or date, filter with Add Filter (Creation Date, Labels, Creator) or delete several hypotheses at once.
#5. Automate the board (optional, admins)
Click Customize workflow to rename lanes, add lanes (up to 10) and set an Automation Rule per lane: No test is running, Any test is running, Any test has result or All tests have results. Click Save. Hypotheses then move automatically as their tests progress.
#6. Link a hypothesis to a test
Open a hypothesis and use the Create a Test dropdown to choose a test type. Or, while creating a campaign in Experimentation > Web Experimentation, select the hypothesis in What hypothesis are you testing?, or add it later under More configurations > Hypothesis. For Feature Management A/B testing rules, select it in the rule's Hypothesis section.
#Check that it worked
- Your observations are listed in Plan > Observations; ones created from reports show View Snapshot.
- In Table View, each hypothesis shows its number (for example, H79), score and Linked Test.
- If automation rules are set, a hypothesis moves to the matching lane once its test starts or gets results.
#Common questions
What's the difference between an observation and a hypothesis? An observation is what you notice: a problem or opportunity. A hypothesis is your proposed solution and its expected effect, which you validate with a test.
Can I change the prioritization framework? Yes. Choose CIE, PIE or ICE from the Prioritization Framework dropdown when you create a hypothesis; the scoring parameters update to match.
Why did the View Snapshot link disappear from an observation? The link is removed if the report the observation was created from has been deleted.
Can I undo deleting hypotheses or observations? No. Deletion is permanent, so review linked items before deleting.
#Learn more
- Observations in Wingify
- Adding Observations to Different Wingify Behavior Analytics Tools
- How to Create Hypotheses in Wingify
- Prioritizing Hypothesis in Wingify
- Monitor and Manage Hypotheses in Wingify Plan
- Set Up and Automate Your Hypotheses Workflow
Help-center sources (9)
- Observations in Wingify
- How to Create an Observation in Wingify
- Adding Observations to Different Wingify Behavior Analytics Tools
- Link Observations to Hypotheses in Wingify
- How to Create Hypotheses in Wingify
- Prioritizing Hypothesis in Wingify
- Linking Hypothesis to a Test in Wingify
- Monitor and Manage Hypotheses in Wingify Plan
- Set Up and Automate Your Hypotheses Workflow in Wingify