
Watch session recordings to find friction
Filter session recordings down to the visits that matter, spot rage and dead clicks, summarize groups of recordings with Wingz, and save or share what you find.
The Wingify Guide can move a cursor on your screen inside the app and walk you through this, click by click (5 steps).
#When to use this
Your checkout conversion dropped and the numbers don't tell you why. Session recordings replay real visits (mouse movements, scrolls and clicks) so you can see where visitors hesitate, loop back, or click repeatedly on something that doesn't respond. Filter to the sessions that matter, then let Wingz summarize the patterns instead of watching dozens of videos.
#Before you start
- The Wingify SmartCode is installed on the pages you want to record.
- You have a Behavior Analytics plan that includes Session Recordings. How long recordings are kept depends on your plan; the retention period is shown on the dashboard.
- Recordings are collected only from sampled visitors. See How Sampling Works.
- Summaries with Wingz are available for Data Platform accounts on the Starter, Growth, Pro and Enterprise plans.
#Steps
#1. Open Session Recordings and start data collection
Go to Behavior Analytics > Session Recordings. The first time, click Enable now. Wingify then records visits on every page with the SmartCode. The All Data card on the right shows your data retention, sessions and page views.
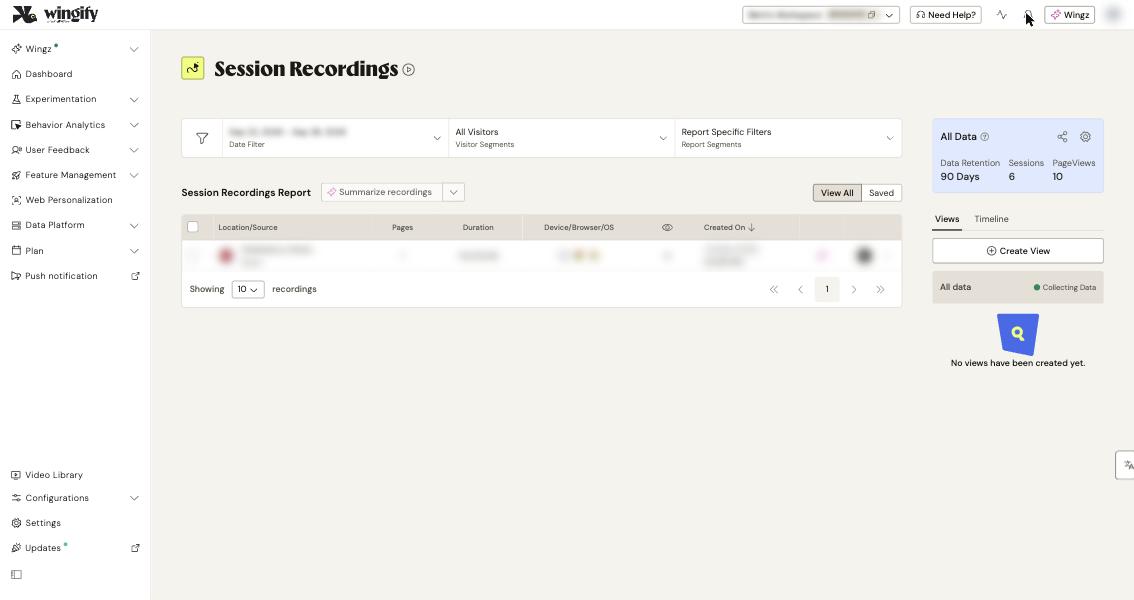
Tip: Click the gear icon to open Configuration: exclude URLs, hide all text with Hide all text on HTML body, anonymize specific elements, or enable Show Canvas elements in recordings. Key presses are always anonymized.
#2. Create a view for the pages you care about (optional)
Click Create View in the right panel. Rename the view with the pencil icon, enter the URL(s) to record (use Advanced for patterns and exclusions), and optionally enable Enable recording a specific visitor group. Set a schedule under Advanced Options if needed, then click Create. A view only collects data from the date it is created.
#3. Filter recordings to the sessions that matter
Use the three filters above the list:
- Data Filter – the date range (last 30 days by default).
- Visitor Segments (shows All Visitors) – segment by attributes such as Landing Page URL, Traffic Source, UTM Parameter, Device Type, Location, VWO Campaign, Funnel Drop Off or Metric Report.
- Report Specific Filters – filter by Page count, Entry Page URL, Visited Page URL, Exit Page URL or Duration. Click Add filter to combine conditions, then Filter.
#4. Find rage and dead clicks
Open All Visitors, go to the Custom section and, from Standard Events, select Rage Click or Dead Click. Other frustration signals are available too, such as Error Clicks, Cursor Thrashes, Quick Back and Page Refresh. Click Apply.
When you play one of these sessions, rage and dead clicks are flagged with icons in the event list. Expand an event to see the element's CSS selector.
Note: Clicks on anything other than a button, link, input field, text area, checkbox or radio button count as dead clicks. To stop an element being flagged, add its CSS selector under Ignore Elements from Dead Clicks in the Behavior Analytics settings.
#5. Play a recording
Click Play on a row (it changes to Viewed afterward). Each row shows location/source, pages, duration, device/browser/OS and creation date. In the player you can speed up playback, skip pauses and jump with the seek bar. A tile shows the visitor's other recorded sessions.
#6. Summarize recordings with Wingz
Hover over a recording and click Summarize for a quick mini-summary, then View full summary for pages visited, user journey, intent, usability patterns and recommendations.
To analyze many sessions at once, open the dropdown next to Summarize recordings and select Create group to analyze. Select recordings for the group (at least five is recommended) and click Done. Add a second group with +Add to compare cohorts, for example North America vs. Europe. Click Summarize recordings, adjust the pre-loaded prompt in the Wingz chat if needed, and click Send Message. Each insight includes citations that open the recording it came from.
#7. Save, share or download
Click the More options icon (⋮) on a recording:
- Save – keeps it in your saved list. Use the Saved toggle to see them; annotated recordings are saved automatically.
- Share link – sends a direct link by email.
- Download – a zip file; unzip it and open
index.html. - Delete – permanent.
To share the whole report, use the Share Report icon on the All Data card.
#Check that it worked
Your view appears in the Views panel, with its activity in the Timeline tab. Recordings show up once sampled visitors have stayed at least 5 seconds on a tracked page. Switching the toggle to Saved lists the recordings you saved.
#Common questions
Why is a recording blank or the styling broken? The visitor may have left in under about 5 seconds, a CORS or Content Security Policy rule may block files, or your CSS changed after the recording. Enable asset snapshotting, allowlist Wingify in your CSP, or install the Wingify browser plugin before playing.
How long can a recording be? A session is recorded for up to 2 hours and 20 page views. It ends after 30 minutes of inactivity or when the tab closes.
Are form entries recorded? No. Key presses are hidden by default. You can also add the nls_protected class to a field to be explicit.
Why don't some dropdown menus appear? Menus that open with a CSS hover effect aren't captured in recordings.
Are iframes recorded? Not as part of the page. An iframe is recorded separately only if the SmartCode is installed inside it.
#Learn more
- Using Session Recordings Dashboard in Wingify
- Filter Session Recordings in Wingify
- Analyze Rage and Dead Clicks in Session Recordings
- Unlock User Behavior Secrets with Wingz in Session Recordings
- Wingify Session Recording FAQs
Help-center sources (7)
- Introduction to Session Recordings in Wingify
- Using Session Recordings Dashboard in Wingify
- Filter Session Recordings in Wingify
- Create a Session Recordings View in Wingify
- Analyze Rage and Dead Clicks in Wingify Session Recordings
- Unlock User Behavior Secrets with Wingz in Session Recordings
- Wingify Session Recording FAQs