
Check that SmartCode works (Debugger, CSP)
Scan a page with the SmartCode Debugger, fix errors such as CSP blocks or wrong placement, and confirm Wingify runs correctly.
The Wingify Guide can move a cursor on your screen inside the app and walk you through this, click by click (5 steps).
#When to use this
The SmartCode is on your site, but a variation isn't showing, visitor numbers look low, or you're about to launch an important campaign and want to be safe. The SmartCode Debugger scans a URL and reports what's wrong, from missing or duplicated code to a Content Security Policy (CSP) or a cookie consent manager that blocks Wingify. For example, a developer tightened the CSP last week and your test stopped showing. A scan tells you in about a minute.
#Before you start
- The website is registered in Configurations > Websites and Apps. You can only scan URLs of registered websites.
- You have Publish, Admin or Owner access. Users with Browse access can't run the Debugger.
- The SmartCode is installed. If not, follow Install the Wingify SmartCode.
#Steps
#1. Open the Debugger
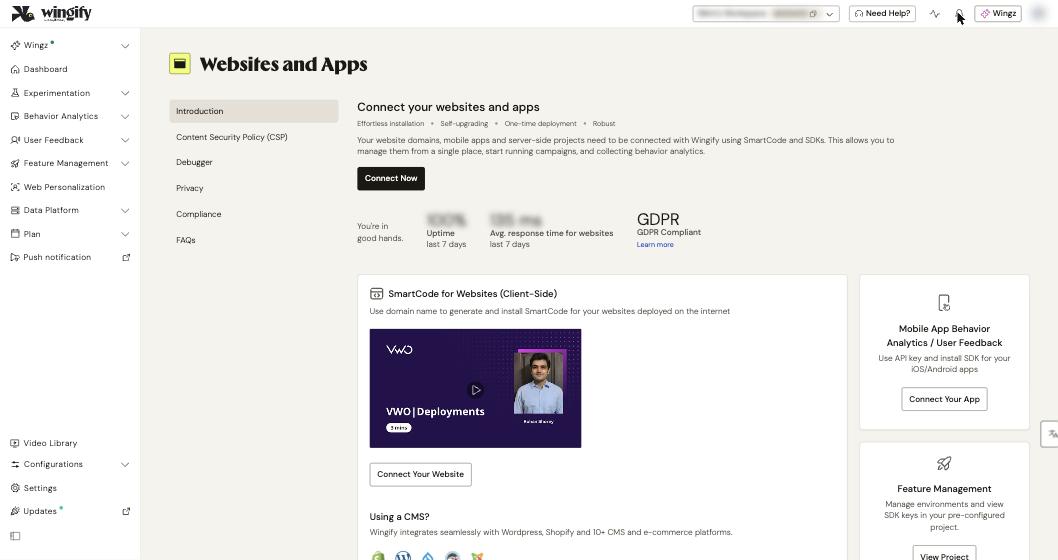
Go to Configurations > Websites and Apps and click Debugger in the page menu. This global Debugger keeps the history of all scans across domains and campaigns. You can also run a scan from:
- a domain: open the domain in Websites and Apps and use its Debugger. Results are stored in that domain's history.
- a campaign: open the campaign and go to REVIEW > Debugger. Results are linked to the campaign. If the campaign uses a single "URL Matches" page, the URL is filled in and a first scan runs automatically.
#2. Scan a URL
Enter the page URL and click Debug. A scan usually takes about 60 seconds, and you can leave the tab while it runs. You can run only one scan at a time, and you can't stop a scan once it has started. If you see Debug Attempt Failed, click Retry.
#3. Read the report
The Debugger Report groups results into four categories:
- Errors: critical issues that can stop the SmartCode or break campaigns.
- Warnings: issues that may affect performance.
- Checks Passed: checks the page passed.
- Checks Skipped: checks that don't apply to this page.
Click a category to see each issue and the recommended fix. Common checks include SmartCode Detection Check, SmartCode Placement Check (code must be in <head>), Duplicate SmartCode Check, SmartCode Account Mismatch, CSP Errors Check, Cookie Consent Failure Check, Third-Party Load Check (code injected by another tool), SmartCode Dynamically Injected and Rocket Loader Script Detected.
#4. Fix CSP errors
If your site defines a Content Security Policy, browsers block content from sources that aren't allowlisted, including Wingify. Variations and previews then fail to load. To fix this, update your CSP directives to allow Wingify. The exact rules are listed on the Content Security Policy (CSP) page in the Websites and Apps menu. Share them with the developer who maintains your CSP.
Note: For preview and QA only, the Wingify browser plugin can work around CSP restrictions. Live campaigns still need your CSP to allow Wingify.
#5. Fix the other issues and rerun
Apply the recommended fixes. For example, move the code into <head>, remove a duplicate snippet, stop loading it through a tag manager, or allow Wingify's cookies in your consent manager. Then click Rerun. To share results, click Email, enter recipients separated by commas and click Send. Recipients get a read-only report.
#Check that it worked
- The rerun shows no Errors.
- To confirm quickly in the browser, open your page's developer tools, go to the Network tab and filter for Wingify calls. With asynchronous code, look for j.php. With synchronous code, look for gv.gif and <your_account_ID>.js.
- For a campaign, go to REVIEW > Live Preview and preview in a new tab. If the preview debugger pane appears, the code is working.
#Common questions
Can I scan any website? No. You can only scan URLs of websites registered in your Wingify account.
Why is Debug greyed out for me? Your role is Browse. Ask an Owner or Admin to give you Publish access or to run the scan.
Where is my scan history? The global Debugger lists every scan with Web Page, Run Time, Run By and Status. Domain and campaign Debuggers show only their own scans.
The code works but the app still says "not installed". Does that affect data? No. The status can take a few minutes to update, and it can't be verified for pages behind a login or for URL patterns. If the code is in your HTML, data is still collected.