
Choose the metrics (goals) that decide your test
Add one primary metric that decides the winner, secondary metrics for context, and create reusable metrics in Data Platform.
The Wingify Guide can move a cursor on your screen inside the app and walk you through this, click by click (4 steps).
#When to use this
Every test needs a clear definition of success. If you are testing a "Request Demo" button, success is clicks on that button; if you are testing a checkout layout, it may be completed orders or revenue. In Wingify, these are metrics (formerly called goals). Metrics are powered by Data Platform, so you define them once and reuse them across campaigns.
#Before you start
- You have a campaign in Draft with Pages and Variations & Traffic configured.
- You know the page, element or event that represents success. For revenue or custom events, the event code must be added to your pages (see the custom event code article below).
#Steps
#1. Open the Metrics step
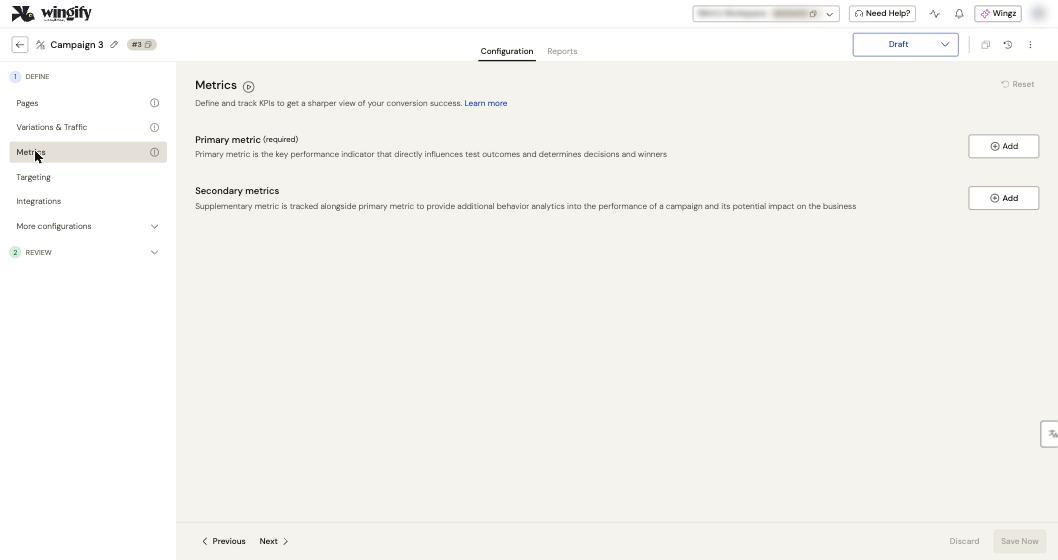
In your campaign, click Metrics in the left pane. You'll see Primary metric (required) and Secondary metrics, each with an Add button.
#2. Choose one primary metric
Click Add under Primary metric. The metric picker shows categories on the left (Action, Page, Custom, Transaction, Browsing Indicators, Funnels) and their metrics on the right. Select an existing metric, or click Create a Metric.
The primary metric decides winners and smart decisions, and every campaign has exactly one. Pick the metric most directly affected by your change: for a CTA test, clicks on that CTA rather than a downstream purchase influenced by many other factors.
#3. Create a metric if needed
In the creation panel:
- Enter a Metric Name.
- Under Visitors event you want to track, pick a standard event (such as page visit, click or form submit) or one of your custom events.
- Click +where to say where it counts: set the URL matching condition and URL, and use +and where to add conditions, for example the button's selector path or text.
- Under Metric will calculate, choose:
- Unique visitors: each visitor converts at most once (click-through, sign-ups).
- Event totals: every occurrence counts (total add-to-carts). Not available for multivariate tests or on the Growth plan.
- First value of an event property: uses a numeric property such as order value, with Sum, Average, Max, Min, First or Last. For revenue, select Format this metric as currency.
- Set Direction of Better: Increase (default) for conversions or revenue, Decrease for things like bounce rate or load time.
- Optionally turn on Enable Global Tracking to collect data independently of any campaign.
- Leave Advanced Settings at the defaults unless you have a reason to change the statistical or guardrail parameters.
- Keep the save-for-reuse checkbox selected so the metric appears in Data Platform > Metrics, then click Create.
Note: Some metrics need an event tracking snippet on the metric URLs. A notice appears on the metric row; the snippet is generated when you save the metric.
#4. Adjust the conversion window (optional)
By default, a conversion counts for the whole Campaign duration. Click the edit icon next to Conversion Window to choose Fixed window or Same session (both Enterprise only), then click Apply.
Warning: Changing a metric's conversion window while the campaign runs flushes that metric's collected data.
#5. Add secondary metrics
Click Add under Secondary metrics and select or create metrics the same way. Use them to watch the broader impact of the change, for example checkout completions when you test an add-to-cart button. You can add as many as you need; they never decide the winner. Funnels from Data Platform can also be added: pick Funnels in the picker.
#6. Mark critical metrics as guardrails (optional)
Select Add as guardrail on a metric row to also monitor it as a guardrail. See Configure SmartStats and guardrails. Click Save Now or Next.
#7. Manage reusable metrics in Data Platform
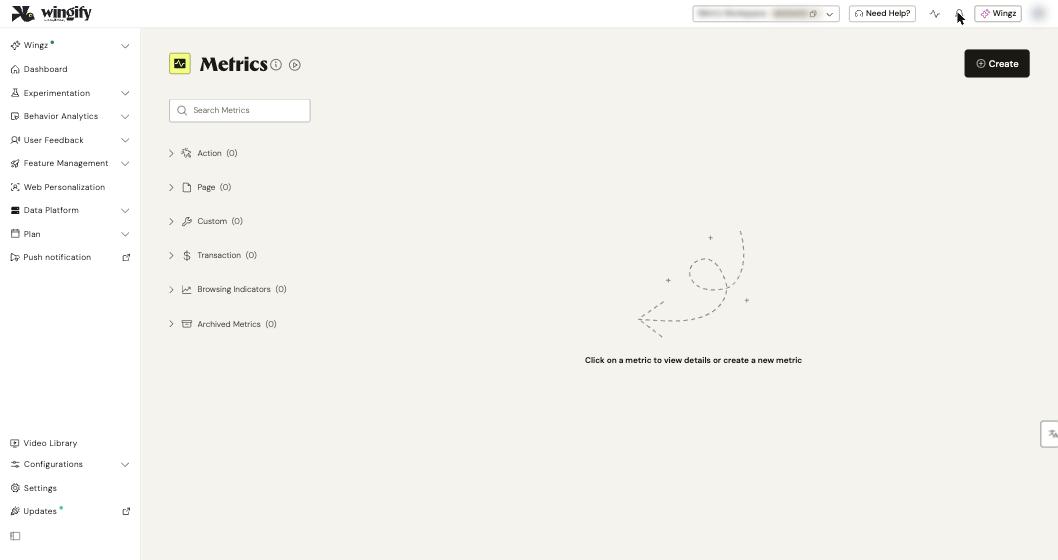
Go to Data Platform > Metrics to browse all metrics by category, search them, or click Create to build one outside a campaign. Use the vertical ellipsis on a metric to Edit, Clone or Archive it. Metrics can't be deleted, only archived.
Warning: Editing a metric's definition flushes data for every campaign linked to that metric. Clone it instead if campaigns are running.
#Check that it worked
- The metric appears under Primary metric with its conversion window.
- Use REVIEW > Live Preview: the QA Assistant shows metric tracking in real time when you perform the action on your site.
- After launch, the Reports tab lists the primary metric first, with secondary metrics below.
#Common questions
Can I change the primary metric later? Use the More options menu on the metric row and Choose different metric. Changing metrics on a running campaign is flagged as an Experimentation Conduct issue, so decide before you start.
How do I track a form without an action URL? Track a page visit on the "thank you" page shown after submission, or send the form submit from Google Tag Manager as an event.
Can I create a metric from the page itself? Yes. In the Visual Editor, select an element and use Track event to create a click, hover, focus or blur metric on it.
What happens to campaigns using an archived metric? They keep using it, with an ARCHIVED tag. Archived metrics aren't available for new campaigns until you unarchive them.