
Report program results with Campaigns Overview and the Impact Dashboard
Review every campaign's status, decision and learnings in Campaigns Overview, export it as CSV, and show the realized and projected revenue impact of your experiments in the Impact Dashboard.
The Wingify Guide can move a cursor on your screen inside the app and walk you through this, click by click (6 steps).
#When to use this
Your quarterly review is coming and leadership asks two questions: what did we test, and what was it worth? Campaigns Overview answers the first with a table of every campaign, its primary metric, decision, impact and learning note, across workspaces. The Impact Dashboard answers the second by turning revenue metrics into realized revenue impact during tests and projected revenue impact from winners.
#Before you start
- For the Impact Dashboard, at least one revenue metric exists in Data Platform and is used as a primary or secondary metric in your campaigns. Without it, projected revenue impact stays empty. See Track revenue and custom conversions.
- The Impact Dashboard covers Web Experimentation (A/B, Split URL, Multivariate) and Feature Management campaigns. According to the help center, access is available on request: contact your Customer Success Manager if you don't see the tab.
- To fill the Impact, Outcome and Learning note columns, document learnings on your concluded campaigns.
#Steps
#1. Open the dashboard tabs
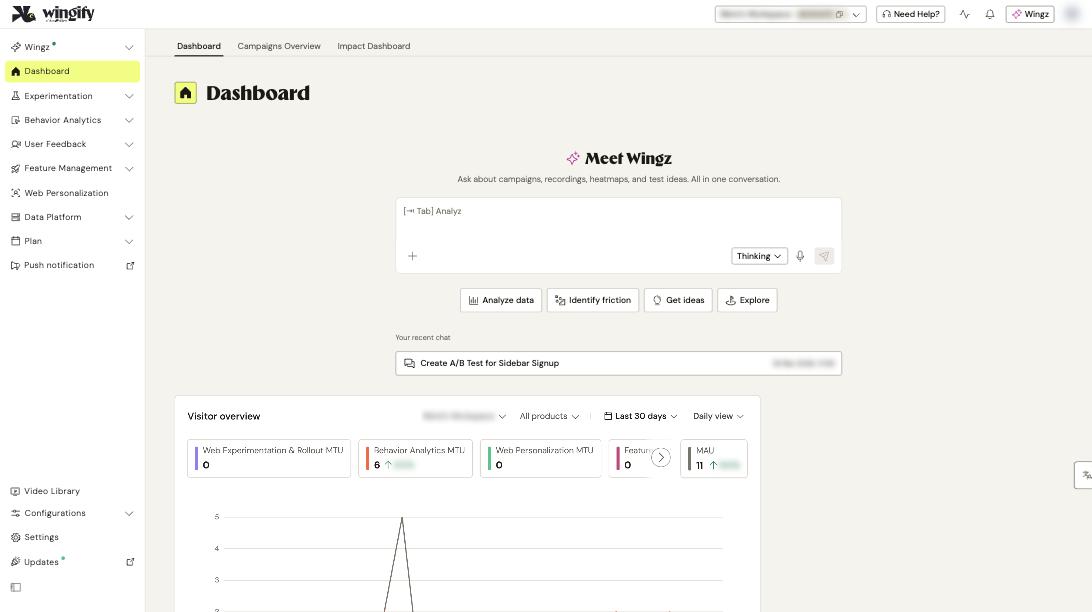
Click Dashboard in the left navigation. Three tabs appear at the top: Dashboard, Campaigns Overview and Impact Dashboard.
#2. Review your campaigns in Campaigns Overview
Click Campaigns Overview. The counters at the top show campaigns With Decision (a conclusion has been declared) and Pending Decision (running or paused, no conclusive outcome yet) for the selected date range (the last 30 days by default).
The table has these columns:
| Column | What it tells you |
|---|---|
| Primary Metric | The metric the campaign is optimized for |
| Decision | The final decision, or a hyphen if none is recorded |
| Leading Variation | The variation currently ahead; not necessarily significant |
| Expected Improvement | The leader's improvement over control on the primary metric |
| Status, Started On, Paused On, Created On, Created By | Lifecycle and ownership |
| Labels | Your campaign tags |
| Impact | Qualitative result: Positive, Neutral, Negative or Inconclusive |
| Outcome | How the result compares to expectations (Expected, Surprising, No impact, Push further...) |
| Learning note | A preview of the documented learning |
| Workspace Name | The workspace the campaign belongs to |
Use the date range selector, the search bar (name or ID) and the column filters (Status, Campaign type, Primary Metric, Workspace Name) to narrow the list. Switch to the Timeline view to see campaign durations and overlaps as a Gantt chart. Click a campaign to open it; if it belongs to another workspace, you're prompted to switch.
#3. Export the list
Click Download CSV to export the current filtered table as a spreadsheet for your report or roadmap review.
#4. Open the Impact Dashboard
Click the Impact Dashboard tab. It shows how your experiments influenced revenue, efficiency and test outcomes in the selected period, with two key figures:
- Realized revenue impact (Test period): the net revenue gain generated while campaigns were running.
- Projected revenue impact (90 days): the expected future uplift from winning variations once deployed.
ROI is calculated only for completed or paused campaigns. A running campaign shows a status such as Campaign in progress instead of a projection, and a campaign without enough data shows In observatory mode. Other messages include No Winning Variation, No Significant Winner and No Revenue Metrics.
Campaigns are grouped by quarter. A campaign spanning several quarters reports realized impact in each of them, and projected impact only in the quarter it concluded.
#5. Adjust settings and filters
Click Settings to choose how revenue is attributed when visitors are in several campaigns at once:
- ROI Optimized Data splits a visitor's revenue equally between parallel campaigns, so a $10 purchase seen by 2 campaigns counts $5 each.
- Report Standard Data credits the full amount to each campaign.
In the same panel, set the projection timeline, choose All Campaigns or Best Winners Only for a conservative estimate, and optionally turn on Include revenue safeguarded to count revenue saved by not deploying losing variations. Click Apply.
Use More filters to narrow the view by campaign type, creator, decision, label or status, and the quarter range selector to change the period.
Tip: For a stakeholder deck, combine the Campaigns Overview CSV (what you tested and learned) with the Impact Dashboard figures (what it was worth). For export and campaign exclusion options on the Impact Dashboard, see the help center article below.
#Check that it worked
- Campaigns Overview lists the campaigns you expect for the date range; if one is missing, widen the range and clear column filters.
- Impact Dashboard figures appear for concluded campaigns that track a revenue metric.
- Numbers on these dashboards are summaries: open a campaign's own report for detailed, real-time results.
#Common questions
Why does the Impact Dashboard show nothing? No revenue metric is linked to your campaigns. Create a revenue metric in Data Platform > Metrics and add it to your campaigns.
Why is projected revenue impact missing for a running test? Projections are calculated only once a campaign is completed or paused with a winning (or safeguarded) decision.
What's the difference between a Leading Variation and a decision? A leading variation is simply ahead right now. A decision means the campaign has concluded and a winner or loser is confirmed.
Can I see secondary metrics in Campaigns Overview? No. The table focuses on the primary metric; open the campaign report for secondary metrics.