
Find your way around Wingify
Learn where each product lives in the left sidebar, what the header controls do, and how to use the three Dashboard tabs.
The Wingify Guide can move a cursor on your screen inside the app and walk you through this, click by click (9 steps).
#When to use this
You have just logged in to Wingify (formerly VWO) and want to know where things are before you start a test, watch recordings or change settings. This guide walks you through the left sidebar, the header at the top of every page, and the three tabs of the Dashboard. Some older help articles use previous names such as "Testing" or "Insights"; the labels below are the ones you see in the app today.
#Before you start
- You have a Wingify account and can log in at app.wingify.com.
- What you see in the sidebar depends on the products in your plan and on your role (Owner, Admin, Publish, Design or Browse).
#Steps
#1. Open the Dashboard
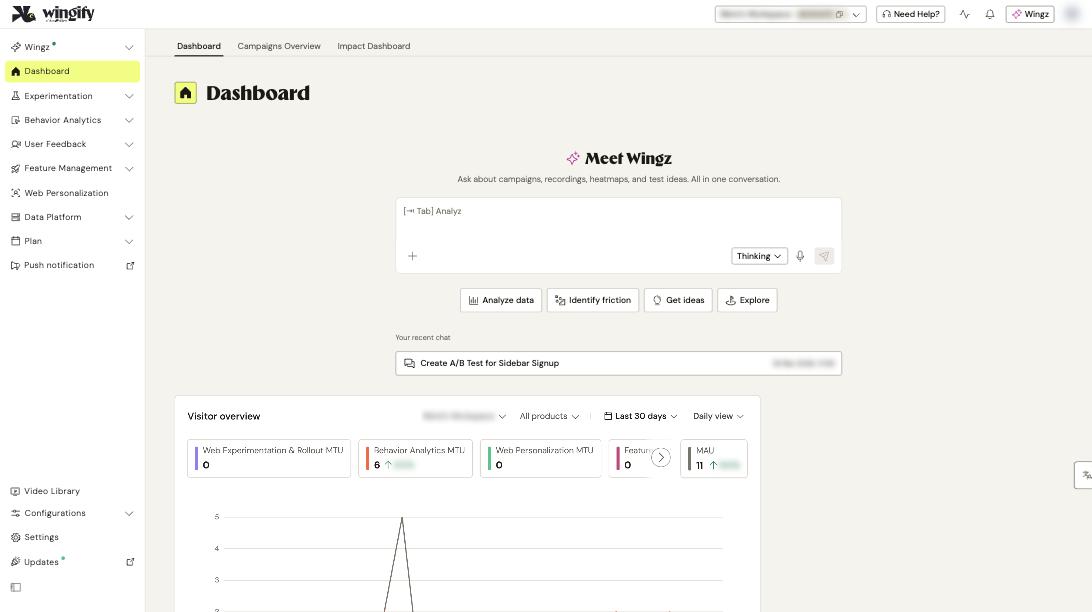
After you log in, Wingify opens the Dashboard. You can always return to it by clicking Dashboard in the left sidebar. The page has three tabs at the top: Dashboard, Campaigns Overview and Impact Dashboard.
On the Dashboard tab, the Meet Wingz box lets you ask questions about campaigns, recordings, heatmaps and test ideas. Shortcut buttons (Analyze data, Identify friction, Get ideas, Explore) start common requests, and Add files, agents and more lets you attach material. Below it, the Visitor overview chart shows visitor usage per product.
#2. Review your campaigns in Campaigns Overview
Click the Campaigns Overview tab to see all campaigns across your workspaces. The summary at the top shows Campaigns, With Decision and Pending Decision for the selected date range (the last 30 days by default). Use the Table view to compare the primary metric, leading variation, status and learnings, or switch to Timeline for a Gantt-style view of overlapping campaigns. Filter by status, campaign type, primary metric or workspace, and click Download CSV to export the filtered list.
#3. Check revenue impact in Impact Dashboard
The Impact Dashboard tab sums the revenue impact of your experiments: Net Revenue Impact, Realized Revenue Impact (Test Period) and Projected Revenue Impact, broken down by quarter.
Note: The Impact Dashboard is available on request (contact your Customer Success Manager) and only shows figures when at least one revenue metric exists in Data Platform.
#4. Explore the product menus in the left sidebar
Each sidebar entry with an arrow opens a menu:
- Wingz: Chat, Agents, Workflows and Synthetic A/B, the AI features.
- Experimentation: Web Experimentation (A/B, Split URL and multivariate tests) and Web Rollout.
- Behavior Analytics: Dashboard, Metric Reports, Funnel Reports, Heatmaps, Session Recordings, Mobile Recordings and Form Analytics.
- User Feedback: Surveys, Concept Test, Templates and Settings.
- Feature Management: Feature Flags, Feature Rollout, Feature Experimentation, Feature Multivariate, Feature Personalization and Tech Debt.
- Web Personalization: opens the personalization campaign list directly.
- Data Platform: Introduction, Profiles, Attributes, Events, Segments, Triggers, Metrics, Funnels, Audit and Data Studio.
- Plan: Observations, Hypotheses and Ideas for your testing roadmap.
- Push notification opens Wingify Engage in a new tab.
#5. Find setup and administration at the bottom of the sidebar
The lower part of the sidebar holds account-level pages:
- Video Library: product videos.
- Configurations: Websites and Apps (SmartCode installation), Integrations, Pages and Asset Hub.
- Settings: account settings such as General, Usage, Users, Security, Privacy Center, Notification Preferences and Profile details.
#6. Use the header controls
The header at the top of every page contains, from left to right:
- Workspace switcher: shows the current workspace name and ID. Click it to search for and open another workspace you have access to.
- Need Help?: your entry point to Wingify help.
- An account usage and activity icon.
- Open notifications (bell icon): in-app notifications, such as campaign status changes or user changes. You choose which ones you get in Settings > Notification Preferences.
- Wingz: opens the Wingz AI assistant from any page.
- Open user menu: your avatar, for your personal account options.
Tip: Only one workspace can be active in your browser at a time. Opening a different workspace in a second tab is not supported.
#Check that it worked
Click Experimentation > Web Experimentation: the campaign list opens with the Create button at the top. Then click Dashboard in the sidebar to return to the start page. If a menu you expect is missing, your plan or role may not include that product. Ask your account Owner or Admin.
#Common questions
I can't find my campaign in Campaigns Overview. Why? Check the date range filter and clear any column filters. Also check in the workspace switcher that you are in the correct workspace.
Is the Campaigns Overview data real-time? It is a regularly updated summary. For the most detailed, up-to-date numbers, click the campaign to open its own report.
Why does the Impact Dashboard show $0.00? No revenue metric is associated with your campaigns. Create a revenue metric in Data Platform and track it in your campaigns.
Where do I start Wingz Chat? Use the chat box on the Dashboard tab, Wingz > Chat in the sidebar, or the Wingz button in the header.